Simulation tools used by Innova range from simple, CAD centric filling and gating studies, to product optimization, highly complex warp predictions, and viscoelasticity load cases.
Presented below are some examples of mold flow projects, many were performed in concert with a design optimization effort prior to tooling release. There are two major benefits to performing a serious mold flow study prior to part release:
Optimization of the design to anticipate any molding problems before the tool is constructed.
Capture of the “as-molded” structural properties of the part not as designed, but as manufactured, enabling highly accurate FEA of the part.
The bottom line-these tools and techniques reduce tool validation times, decrease or eliminate unanticipated part failures, and provide indicators for dimensional stability before releasing the part.
Formally the domain of the tool shop, the value of performing these types of studies as a component of the design and part engineering process is well established.
Review the examples below and see how your project can benefit from using advanced mold flow simulation.
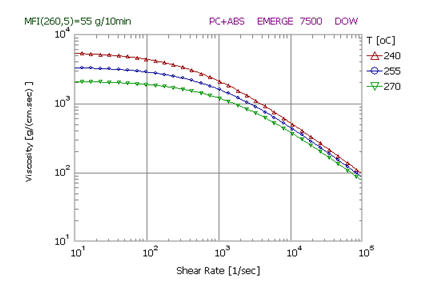
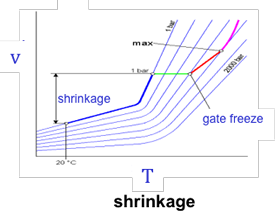
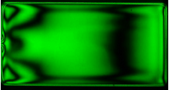
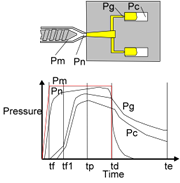
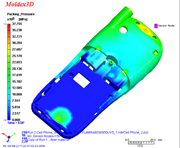
(Fig 1.) Typical Material Curve (PC/ABS)
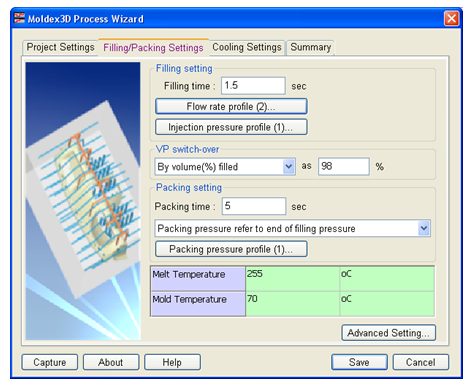
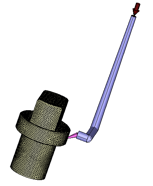
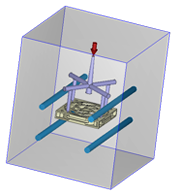
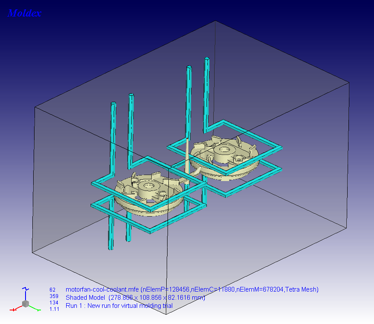
(Fig 2.) Simulation environment set up
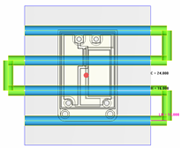
(Fig 3.) Part, gate, and runner mesh
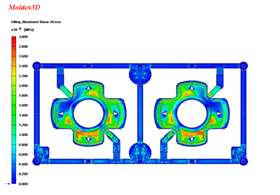
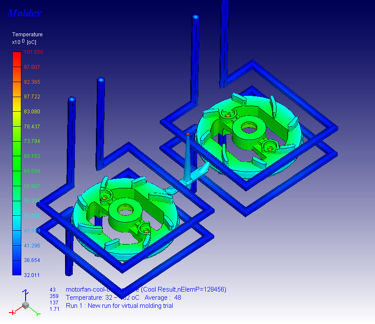
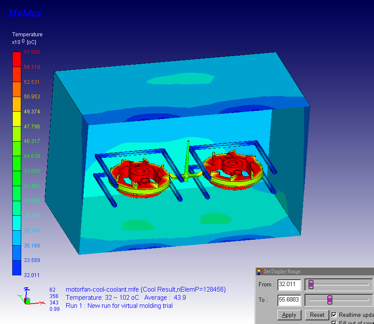
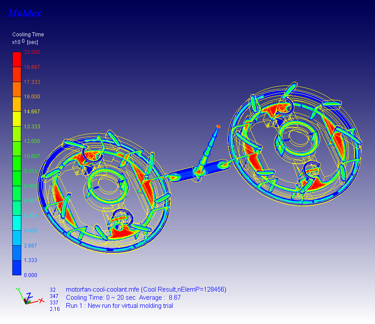
Detailed filling, packing, cooling, and warp studies are developed using full 3D fluid elements for the gate and runner modeling-critical to achieving accurate results.
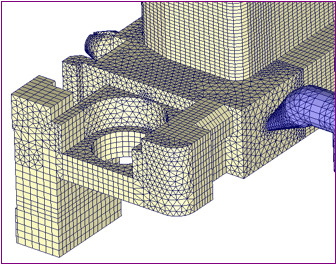
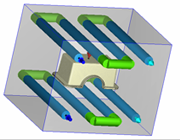
(Fig 4.) Part, gate, and runner mesh
One of the more interesting “tricks” for advanced 3D mold flow analysis, is to utilize a combination of high order hexahedral elements to capture the boundary layer (plastic in contact with the mold surface), with low order tetrahedrals for the remainder, allowing high computational efficiency with extremely accurate results.
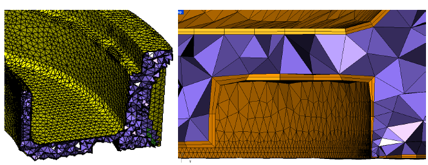
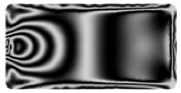
(Fig 5.) Boundary layer meshing
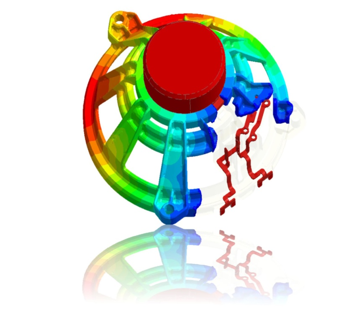
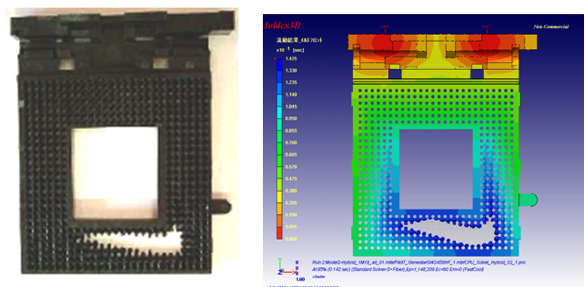
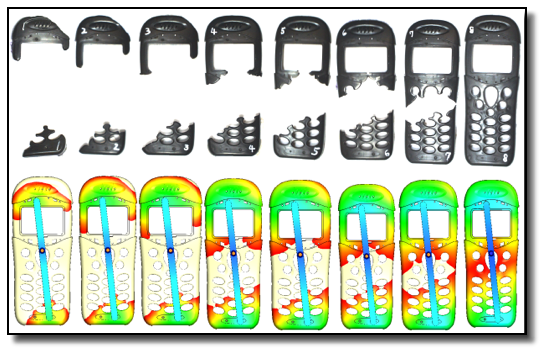
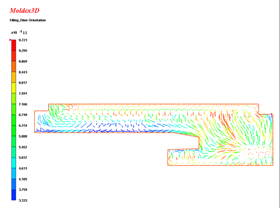
(Fig 7.) Melt front prediction

Using the fiber orientation functionality, the following example shows how this can affect the as molded part condition.
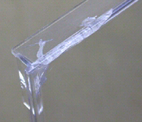
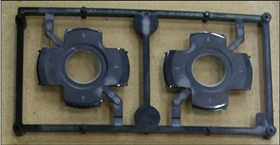
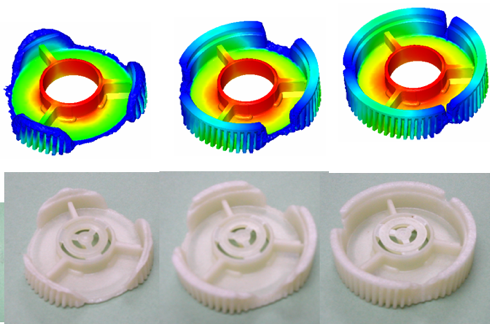
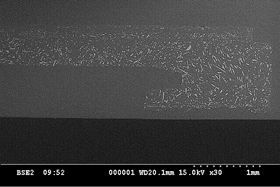
The examples below show the predicted fiber orientation before the part was molded, and the subsequent view is a photographic section showing the actual part after molding. The results show good correlation.
WITH FIBER
WITHOUT FIBER
WITH FIBER
WITHOUT FIBER
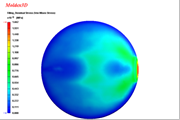
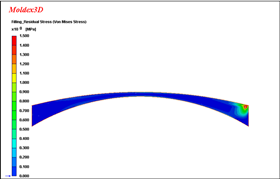
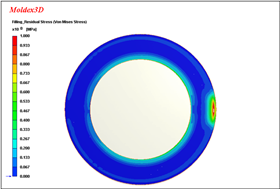
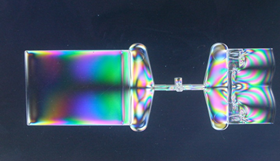
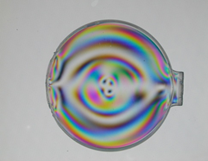
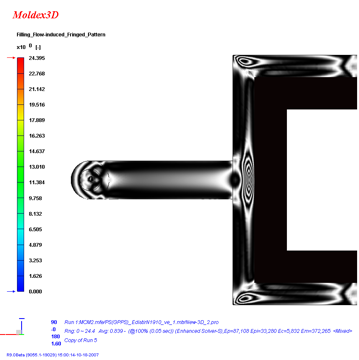
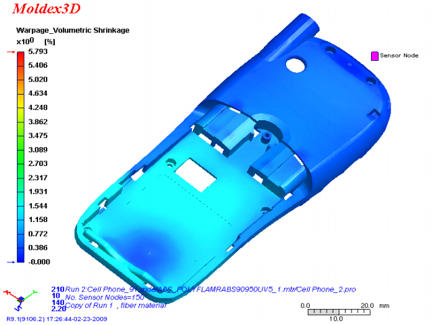
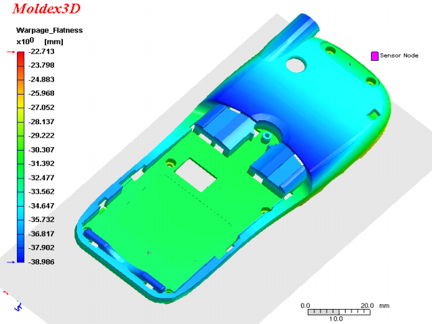
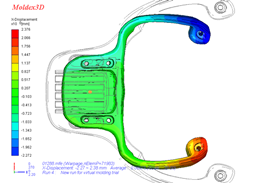
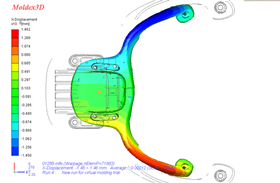
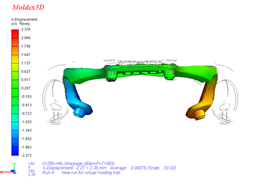
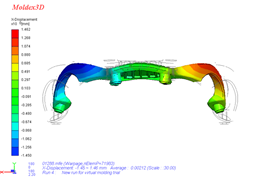
The combination of thermally induced stress, with the flow induced stress of the filling process leaves us with some residual stress values after the part is ejected from the tool. These stress fields can cause distortion, time dependent dimensional shift, and weak areas in the part-all of which can be predicted before releasing the part for tooling.
In addition, these properties can also be exported to third party FEA solvers for structural analysis- a very useful capability.